System Info
- Monitor All High Pressure Steam Traps Wirelessly in Real-Time (over 15PSIG)
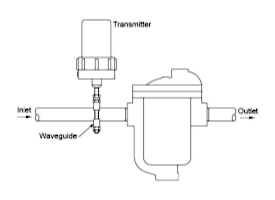
- Ultra Sonic / Temperature Sensor Clamps on to Inlet of HP steam trap
- Can detect when a steam trap is passing steam or backing up condensate
- Sends Email Alarm upon trap failure
- Web Based and Modbus compatible
- Consistent 12 to 18 Month Payback
- Systems are fully supported and monitored by Mosto Technologies
- Pictures / Diagrams
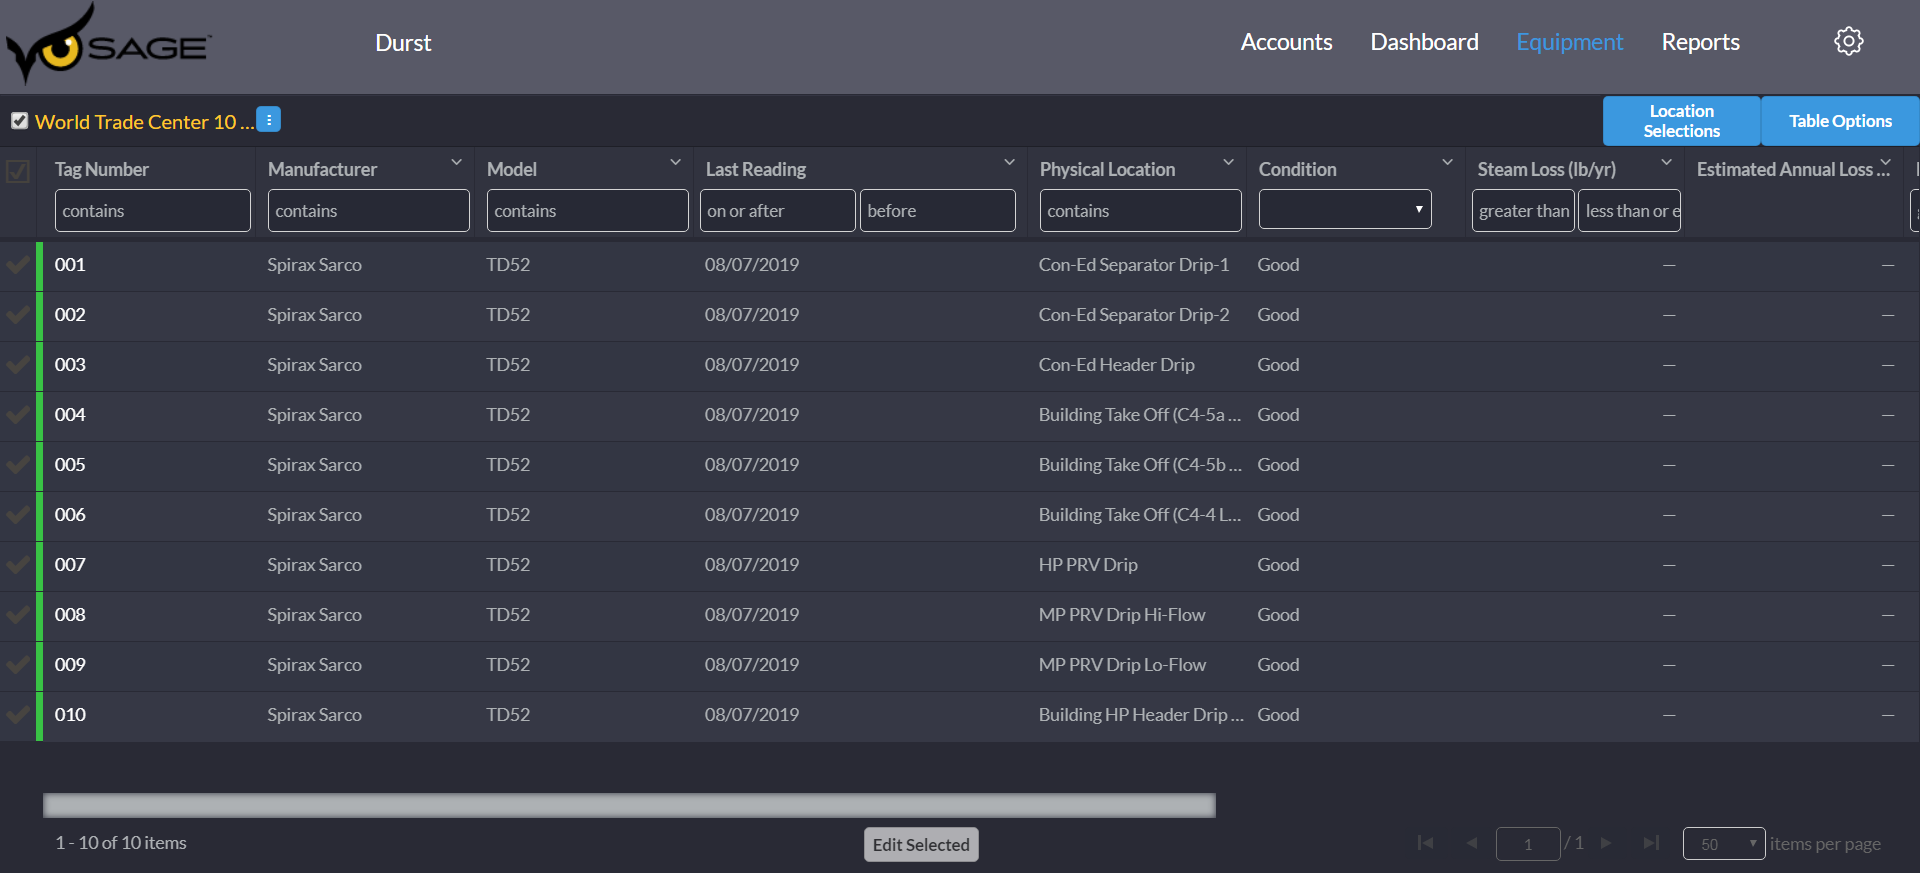
Trap inventory page on Sage.
Shows current state of all monitored traps
Case Study – Leading Cancer Research Hospital in NYC
Background Information:
- Leading Cancer Research Hospital
- 8 Buildings (2.2 Million Sq Ft)
- 195 High Pressure Steam Traps
- 5 Separate Systems
- Implemented in 3 phases
- Phase 1 was completed May of 2008 (102 Steam Traps)
- Phase 2 was completed Jan of 2010 (61 Steam Traps)
- Phase 3 was completed June of 2011 (32 Steam Traps)
- The largest institutional Con Ed steam customer in New York City wanted to lower its operational steam costs.
- High pressure steam is utilized at the hospital for distribution, refrigeration, and sterilization.
- Concluded that a high pressure steam trap monitoring system manufactured by Armstrong International called Steameye would help the facility lower its operational costs.
- Steameye provides the ability to prevent high pressure steam traps from passing steam for extended periods of time. Detecting failures in a matter of hours rather than days or months
- Mosto Technologies remotely monitors the system via a web based platform called Steam Star.
- Mosto Technologies has found that buildings with more than 10 high pressure steam traps at their facility, and spend more than $300,000 per year on steam are an ideal candidate for the system.
Scope of Work
- Locate all High Pressure Steam Traps in the campus
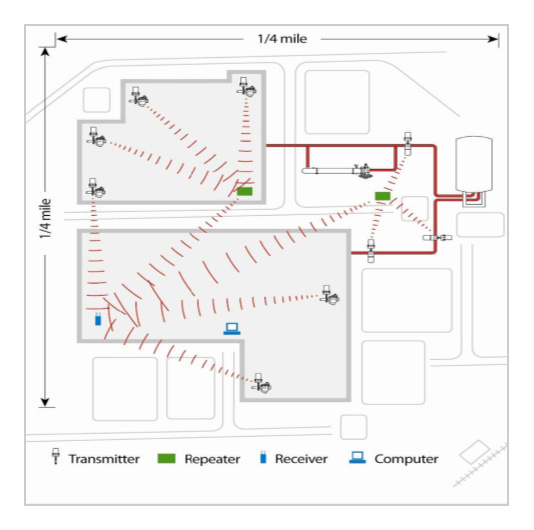
- Design wireless sensor network path throughout all 8 buildings
- Develop Equipment List (# of Transmitters, # of Repeaters, and # Gateway Receivers)
- Install high pressure wireless sensor transmitters on the inlet of every high pressure steam trap
- Install network of repeaters in specific locations to ensure optimal wireless signal strength
- Integrate gateway receivers with building Ethernet network
- Commission system (Confirm transmitters are calibrated and reading actual trap state)
- Confirm, Track, and Develop savings analysis once the system is fully operational
Results / Savings Analysis
Throughout the year, the high pressure steam trap monitoring system is remotely monitored, and provides email alarms upon steam trap state change. Steam trap failures are confirmed through onsite testing. Savings analysis of the failed trap is then performed based on annual savings and the average annual cost of Con Ed steam.
Phase 1
- 4 systems installed in a total of 7 buildings with 102 steam traps.
- The system located a total of 4 failed steam traps on the day the system was commissioned.
- The savings of the 4 steam traps provided about 40% of the payback for the system
- Mosto Technologies confirmed a payback of 11 months
Phase 2
- Phase 2 included the addition of a new state of the art research facility.
- A total of 61 steam traps, with 1 system was installed in the facility.
- Since the building was new there were fewer failures during the commissioning of the system.
- Mosto Technologies confirmed a payback of 15 months
Phase 3
- Included new addition to the large research facility as well as sanitation equipment on 22 floors.
- A total of 32 steam traps were added to the system installed in phase 2.
- Over 1000 points can be added to system as needed.
- Again most of the equipment in this phase is new so the payback is pushed out a little bit.
- Mosto Technologies confirmed a payback of 14 moths with this phase. (Note that costs were lower since repeaters and receiver were included in phase 2)
The following table displays the continual tracking and savings analysis provided by Mosto Technologies. Each trap is analyzed based on the size of the steam trap, pressure, and application. All of the recorded results were confirmed through the testing of a Mosto Technologies engineer. Savings are based on annual numbers.
| Year | # of Failed Traps | Savings | |||
| 2008 | 6 | $63,936 | |||
| 2009 | 5 | $58,320 | |||
| 2010 | 4 | $52,260 | |||
| 2011 | 6 | $63,990 | |||
| 2012 | 7 | $63,264 | |||
| Total | 28 | $301,770 |
- Note: 2008 and 2009 Based on $25 per Mlbs
- Note: 2010 Based on $27 per Mlbs
- Note 2011 and 2012 based on $28 per Mlbs
Please Call or Email to schedule a walk through to discuss the system